"During 2016, Earth's globally averaged surface temperature was 0.94$^{\circ}$C higher than the twentieth-century century average. All 16 years of the twenty-first century rank among the 17 warmest years on record." - National Oceanic and Atmospheric Administration (NOAA)
If you know me I deeply care about the health of our planet. The biggest threat our civilization and the life of planet right now is global warming. According to Intergovernmental Panel on Climate Change - "Scientific evidence for warming of the climate system is unequivocal". "Majority of Scientists agree that rising temperatures will fuel longer and hotter heat waves, drought, crop failures, powerful hurricanes, rising sea levels, flooding of coastal cities, mass migration crisis and mass extinction." - CNN.
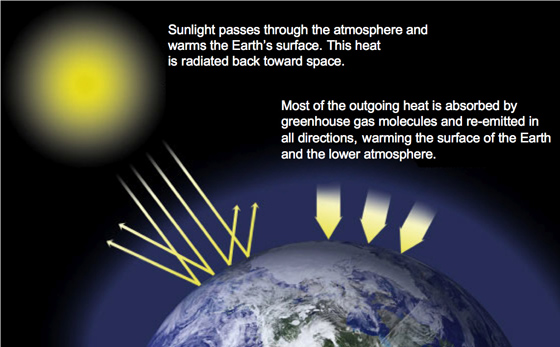
 Source: NASA
The invisible culprit - anthropogenic greenhouse gases (GHG) emissions. These gases collect in the atmosphere and absorb sunlight and solar radiation that increases the earth's temperature. The increase in greenhouse gas emissions is the major driver of climate change.
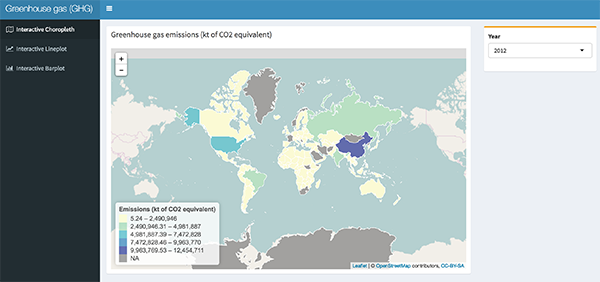
In this project, I explore greenhouse gas emissions data for all the countries from worldbank. We asked - which countries share a bigger share of responsibility to curb the emissions? In the process, I build a Shiny app to interactively explore 42 years of greenhouse gas emissions data through different visualizations.
My app can be accessed at https://arjan-hada.shinyapps.io/greenhouse-gas/. Let me know what you think of the app.

Reference
1) R for Data Science
2) Data Analysis with R
3) A Unique Visualization of Greenhouse Gas Emissions
4) Climate Change: Global Temperature
3) Worldbank Greenhouse gas emissions
4) Leaflet for R
5) World Development Indicator
6) Country Polygons as GeoJSON
7) WDI leaflet tutorial
8) Shiny app - movie-explorer
9) Shinydashboard examples
10) Shiny app - superzip-example
Comments
comments powered by Disqus